Olfactory Group
A major way by which animals learn about their environment is through their sense of smell. Odors provide critical information about an animal’s food source, potential mates, their offspring, as well as parameters to avoid such as predators. The labs that are part of the Olfactory Cohort seek to understand the basic circuit mechanisms that underlie how animals detect and discriminate odors, as well as how these mechanisms are impacted by higher order brain functions such as attention and reward. In addition, it is becoming increasingly clear that olfaction is severely impacted by many common neurological disorders, often before other brain functions are affected, and so a focus of our labs is to examine the mechanisms underlying these disorders. We use a range of approaches, including in vitro and in vivo electrophysiology, advanced imaging, computational and ultrastructural techniques, behavioral studies, as well as viral/genetic methods to trace circuitry and manipulate cell function.
/nathan-schoppa----100-x-125.jpg?sfvrsn=605f6db9_4) | Professor; Co-Director, Neuroscience Graduate Program Neurophysiology of the olfactory system |
/sukumar-vijayaraghavan----100-x-125.jpg?sfvrsn=677563b9_4) | Professor Acetylcholine receptor function in the central nervous system |

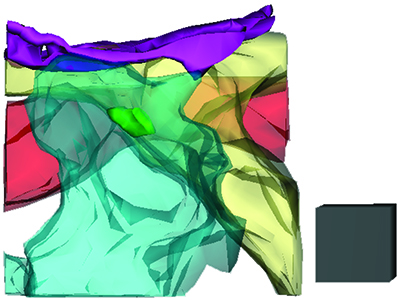
Ultrastructural features that favor tufted cell-to-mitral cell extrasynaptic signaling
The image shows a three-dimensional reconstruction of the neuropil space around a synapse (green) between a tufted cell (yellow) and periglomerular cell (blue) in the olfactory bulb. A dendrite of a mitral cell (red) runs adjacent to the synapse, which makes it well-positioned to sense extrasynaptic glutamate that is released at the synapse. An astroglial process (purple) is also evident, but note that it is positioned at some distance away from the synapse.

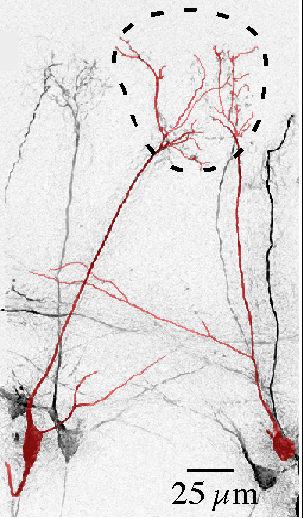
Pair of same-glomerulus mitral cells in the olfactory bulb
Two mitral cells associated with the same glomerulus (dashed ring) were filled with a dye (Alex-488) in olfactory bulb slices. These mitral cells, which carry information about the same odorant receptor in the nose, engage in electrical coupling and extrasynaptic glutamatergic interactions within glomeruli that amplify and synchronize their responses.

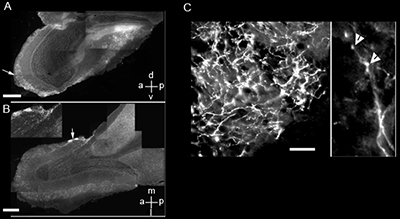
Micrographs of main olfactory tissue from ChAT-tauGFP mice show regions of high labeling in the glomerular layer
A. Parasagittal section. Arrow points to the glomerular region with higher intensity labeling. Scale bar = 500 mm. Plane orientation d = dorsal, v = ventral, a = anterior, p = posterior. B. Micrograph of a coronal cross-section of the bulb showing two atypical glomeruli (arrow) with high density of ChAT-tauGFP fibers. Scale bar = 500 mm. Plane orientation m = medial, l = lateral, a = anterior, p = posterior. B inset magnified image of the two atypical glomeruli. C- Left panel. Magnified image of an atypical glomerulus showing diffuse, high density of cholinergic fibers. Scale bar = 20 mm. Right panel. Image of a cholinergic axon showing varicosities (arrowheads), potentially transmitter release sites.